

Baby Growth Chart Percentiles: How to Read Them and When to Worry
By Simple Baby Tracker Editorial TeamGrowth
What does 30th percentile mean? WHO vs CDC charts, why crossing two percentile lines matters, and how to track growth against WHO standards.
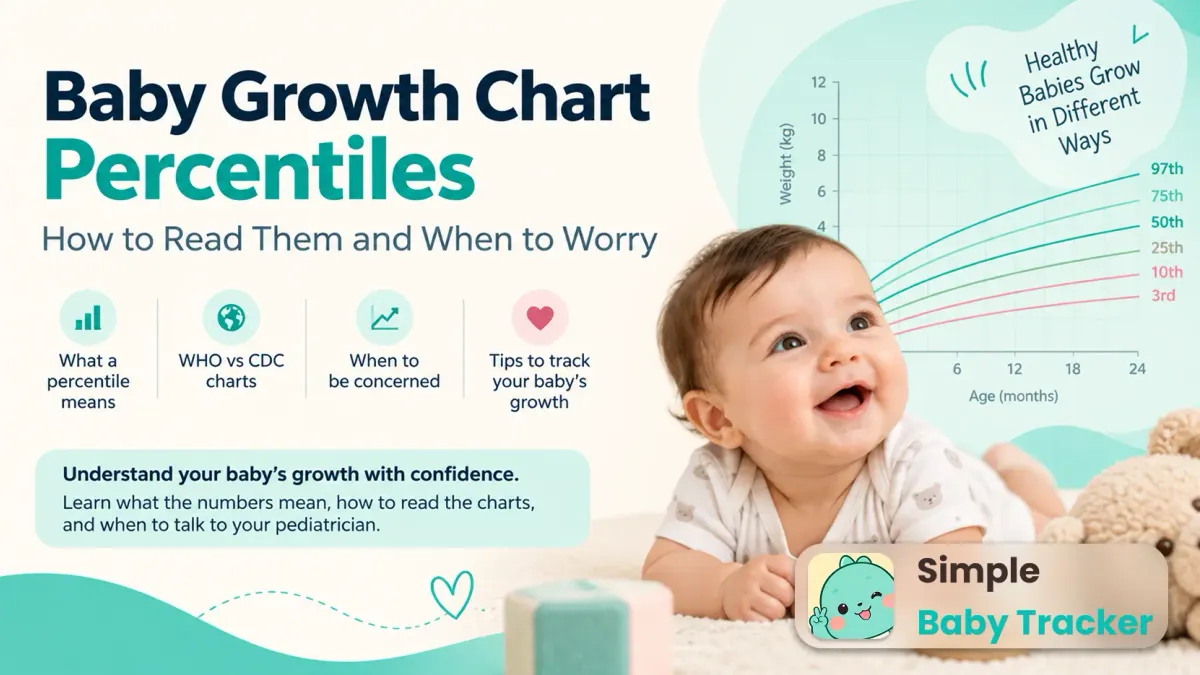
Key Takeaways
- A percentile is a ranking, not a grade: 30th percentile means your baby is bigger than 30 out of 100 healthy babies the same age and sex, per WHO standards 12.
- For babies 0-24 months, the CDC recommends the WHO Child Growth Standards; CDC charts take over at age 2 2.
- One low or high dot rarely matters. The signal pediatricians watch is the trend: crossing two or more major percentile lines (e.g. 50th → 25th → 10th) or falling below the 3rd / above the 97th percentile deserves a prompt visit 345.
- Plot every measurement on the same chart. Our free WHO growth percentile calculator gives you the percentile in seconds, and Simple Baby Tracker’s built-in growth tracker plots each weigh-in against WHO curves so the trend is visible visit to visit.
What a percentile actually means
“Your baby is in the 30th percentile for weight” confuses almost every parent the first time they hear it. It sounds like a test score. It is not.
A percentile is a ranking against a reference population of healthy children the same age and sex. 30th percentile for weight means: out of 100 healthy babies that age and sex, about 30 weigh less and about 70 weigh more 25. A baby at the 5th percentile is small but can be perfectly healthy; a baby at the 95th is large and can be perfectly healthy. The number alone is never a diagnosis.
Three things follow from this definition that most explainers skip:
- There is no “100th percentile baby” to aim for. The 50th is the median, not the goal. Healthy babies live all along the curve.
- Weight and length percentiles often differ. A baby can be 70th for length and 30th for weight and be entirely normal — that combination just describes a long, lean baby.
- One dot is a snapshot; the line is the story. Pediatricians plot each visit’s dot and connect them. A stable line along the 10th percentile is usually reassuring; a line sliding from the 60th to the 20th over two visits is what gets attention 34.
If you are new to logging measurements at all, our guide to what to track in your baby’s first year covers which growth, feeding, and milestone logs pair together.
WHO vs CDC: which chart your baby is on
This is the single most common source of confusion, because the answer changes at age two:
| Age | Chart | Built from |
|---|---|---|
| Birth to 2 years | WHO Child Growth Standards | Longitudinal study of healthy, breastfed infants in six countries (the Multicentre Growth Reference Study) 1 |
| Age 2 to 20 years | CDC Growth Charts | Mostly cross-sectional US population data 2 |
The CDC explicitly recommends the WHO standards for US children from birth to 2 years, switching to CDC charts at age 2 — and warns that the transition needs care because the two references do not join seamlessly 2.
Why it matters for you: percentiles computed on the wrong reference are wrong numbers. A 14-month-old plotted on a CDC chart gets a subtly different percentile than on the WHO chart she should be on. This is also why our free WHO growth percentile calculator uses the WHO LMS tables for 0–24 completed months only and refuses to extrapolate beyond them — a calculator that silently extends the curve past its range manufactures false precision.
How to read the chart dot by dot
A growth chart looks intimidating but reads like any line graph once you know the three elements:
- The axes. Horizontal = age (months), vertical = weight or length. Boys and girls have separate charts — always check the sex label first, because a dot plotted on the wrong sex’s chart is meaningless.
- The curved lines. Each curve is a percentile channel: 3rd, 10th, 25th, 50th, 75th, 90th, 97th on WHO charts. Your baby’s dot lands in a channel (say, between the 25th and 50th), and the calculator interpolates the exact percentile.
- The dots over time. Connect two or more dots and you get your baby’s personal curve. That curve running roughly parallel to the printed lines — even along a low channel like the 10th — is the classic picture of healthy growth 45.
A worked example: a 6-month-old boy weighing 7.9 kg sits almost exactly on the WHO 50th percentile for weight-for-age; at 67.6 cm he is again near the 50th for length-for-age. Try your own numbers in the calculator — enter sex, age, weight, and length, and it returns both percentiles with the plain-language band (below 3rd / typical 3rd–97th / above 97th).
One technical note worth knowing: WHO uses completed months (floor of age). A baby aged 6 months and 3 weeks is plotted at 6 months, not 7. Our calculator applies the same flooring convention so its percentiles match what your pediatrician’s software produces.
When a percentile is fine — and when it is not
Most percentile anxiety resolves into three cases:
Case 1: stable and low (or high). A baby who has tracked along the 8th percentile for weight across three visits, eats well, meets milestones, and has normal diapers is usually just a small baby. Consistency is the reassurance 45.
Case 2: crossing lines downward. This is the pattern research flags. Studies of infant growth find that crossing two or more major percentile lines downward (major lines: 3rd, 10th, 25th, 50th, 75th, 90th, 97th) is associated with growth faltering and deserves evaluation — the AAFP reviews this as the working definition behind failure-to-thrive assessment in children under two, plotted on WHO charts 34. A drop from the 50th to the 25th across one interval can be measurement noise (different scale, full bladder, stretched vs. unstretched length); a continued slide to the 10th is not.
Case 3: crossing lines upward. Rapid upward crossing — two or more major lines — is also a signal: research links upward crossing of weight-for-length lines in infancy to higher obesity risk in childhood 6. Not an emergency, but worth discussing feeding volumes at the next visit. Our formula feeding chart by age and newborn feeding guide give the intake ranges pediatricians anchor on.
Red lines that warrant a prompt call rather than waiting for the next well-child visit:
- Weight below the 3rd percentile or weight-for-length above the 97th, newly appearing 45.
- Any downward crossing of two major lines between visits 34.
- Growth slowdown plus red-flag symptoms: persistent vomiting, diarrhea, refusal to feed, lethargy, or developmental regression.
- No catch-up within 2–3 months after a preterm baby’s adjusted-age correction window (preemies get their own conversation — always use adjusted age until your pediatrician says otherwise).
If a checkup ever felt rushed, bring the numbers: dated weights, lengths, and which scale each came from (home vs. clinic). A dated log turns “she seems smaller” into a curve the pediatrician can read in seconds.
Track it against WHO curves, not memory
Growth is the slowest-moving thing you track — which is exactly why memory fails at it. Nobody remembers whether the 4-month weigh-in was 6.4 or 6.7 kg, and that half-kilo is the difference between “parallel to the curve” and “crossing a line.”
The workflow that works:
- Log each measurement the day it happens — clinic visits, plus home weigh-ins if you have an infant scale. Date, weight, length, and where it was measured.
- Check the percentile immediately with the WHO growth percentile calculator so a miscopied number gets caught while the visit is fresh.
- Watch the curve, not the dot. This is where an app earns its place: Simple Baby Tracker’s built-in growth tracker plots every entry against WHO standard curves, so crossing lines show up as a visible bend in your baby’s line — no spreadsheet, no replotting by hand. Each entry stays in the same timeline as feeds, diapers, and milestones, so at the next visit you hand the pediatrician the whole pattern, not an estimate from 3 AM memory. Get it on Google Play — 50 logs free, then a single one-time unlock, no subscription.
Parents sharing care should share the log too: when grandparents cover weigh-ins or clinic runs, one shared record means nobody double-enters or loses a dot. Our guide to sharing the tracker with a partner covers the setup.
Frequently asked questions
Is the 50th percentile the goal?
No. The 50th is the median of the healthy reference population — half of healthy babies sit above it and half below 25. A baby stable at the 15th or 85th percentile is as healthy as one at the 50th, provided the line runs parallel to the curve and feeding and development are normal.
My baby dropped from the 40th to the 20th percentile. Should I worry?
One interval of slippage is often noise — different scales, clothing, time of day, or a length measured slightly stretched. Re-measure at the next visit on the same equipment. If the slide continues and crosses a second major line (e.g. 40th → 20th → 10th), call your pediatrician promptly rather than waiting 34.
Why did the percentile change when my baby turned 2?
Because the reference changed. Under-2s are plotted on WHO standards; from age 2 the CDC charts apply, and the two references join with a visible step 2. A small percentile jump at the second birthday is usually the chart switch, not your child.
Do breastfed and formula-fed babies use the same chart?
Yes — the same WHO chart for every baby under 2 12. The WHO standards were built from predominantly breastfed infants, which is precisely why the CDC adopted them: they describe how healthy babies should grow. Feeding type does not change which chart to use; it changes the conversation about the curve.
How often should I weigh my baby at home?
For healthy term babies, clinic weigh-ins at well-child visits are enough — weekly home weighing adds noise, not signal. Weigh more often only if your pediatrician asks (catch-up growth, feeding concerns, preterm follow-up), and always bring the dated log to the visit.
Disclaimer: This article is for informational purposes only and does not constitute medical advice. Growth assessment requires a trained clinician with calibrated equipment and your baby’s full history. Always consult your pediatrician with questions about your baby’s growth, feeding, or development.
Footnotes
-
WHO Multicentre Growth Reference Study Group, “WHO Child Growth Standards: Length/height-for-age, weight-for-age, weight-for-length, weight-for-height and body mass index-for-age: Methods and development.” Source ↩ ↩2 ↩3
-
CDC, “Using WHO Growth Standard Charts,” Growth Chart Training. Source ↩ ↩2 ↩3 ↩4 ↩5 ↩6 ↩7 ↩8
-
JAMA Pediatrics, “Crossing Growth Percentiles in Infancy and Risk of Obesity in Childhood.” Source ↩ ↩2 ↩3 ↩4 ↩5
-
AAFP, “Growth Faltering and Failure to Thrive in Children,” Am Fam Physician 2023. Source ↩ ↩2 ↩3 ↩4 ↩5 ↩6 ↩7 ↩8
-
CDC, “Growth Charts: What to Know,” information for healthcare professionals. Source ↩ ↩2 ↩3 ↩4 ↩5 ↩6
-
Mei et al., “Shifts in percentiles of growth during early childhood,” analysis of California Child Health and Development Study longitudinal data. Source ↩